Uncategorized files
Jump to navigation
Jump to search
Showing below up to 250 results in range #1 to #250.
-
 1.jpg 700 × 320; 40 KB
-
 1.png 542 × 264; 128 KB
-
 2.jpg 850 × 750; 109 KB
-
 25438674 561827514154994 4686891186473369938 o.jpg 1,080 × 1,440; 107 KB
-
 3.jpg 400 × 267; 27 KB
-
 4.png 1,411 × 569; 106 KB
-
 4FASTQC.png 910 × 511; 128 KB
-
 5.png 893 × 601; 69 KB
-
 5MULTIQC.png 875 × 366; 43 KB
-
 6.png 1,390 × 681; 136 KB
-
 6fastqc.png 1,390 × 682; 130 KB
-
 AbInit ncRna Blast.png 1,000 × 598; 5 KB
-
 Annotation Pipeline.png 695 × 543; 39 KB
-
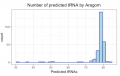 Aragorn results.png 998 × 634; 101 KB
-
 Aroon.jpg 460 × 460; 16 KB
-
 Assembly Homework.pdf ; 342 KB
-
Assembly Homework 2.pdf ; 341 KB
-
 Assembly Homework Word.odt ; 589 KB
-
 Assembly Page.png 1,646 × 896; 209 KB
-
 Assembly flowchart.png 416 × 116; 4 KB
-
 Assembly of unmapped reads.png 1,375 × 272; 233 KB
-
 Assembly team1.PNG 1,151 × 603; 33 KB
-
-
-
 AyushSemwal.jpg 2,713 × 2,749; 3.71 MB
-
BIOL7210A 2018 syllabus.pdf ; 28 KB
-
 B a.png 1,405 × 693; 133 KB
-
Background and Strategy.pdf ; 1.3 MB
-
 Bacterial Genomics.png 548 × 495; 283 KB
-
 Bacterialgwas.png 1,871 × 199; 35 KB
-
 Barchart1 mlst.png 904 × 572; 106 KB
-
 Barchart2 mlst.png 1,396 × 836; 140 KB
-
 Barchart3 mlst.png 1,392 × 830; 117 KB
-
 Beatriz saldana.jpg 2,253 × 3,006; 1.75 MB
-
 Blast.gif 554 × 332; 14 KB
-
 Blast Hits.png 1,000 × 598; 10 KB
-
 Box plot egg.png 465 × 453; 43 KB
-
 Bozzy.jpg 795 × 795; 52 KB
-
 Brian Merritt.JPG 1,350 × 1,800; 2.04 MB
-
 Bwt1.png 415 × 217; 35 KB
-
 Bwt2.png 341 × 196; 31 KB
-
 Bwt3.png 386 × 216; 25 KB
-
 Bwt4.png 757 × 523; 171 KB
-
 Bwt5.png 587 × 234; 33 KB
-
 Bwt6.png 692 × 321; 76 KB
-
 Bwt7.png 708 × 376; 108 KB
-
 Bwt8.png 707 × 377; 159 KB
-
 CARD.png 1,455 × 742; 61 KB
-
 CARD v.png 1,312 × 1,292; 415 KB
-
 CRISPR.png 2,222 × 1,104; 658 KB
-
 CV.jpg 160 × 195; 9 KB
-
 Card flowchart.png 470 × 221; 8 KB
-
 Casey.jpg 204 × 216; 8 KB
-
 Choice of Reference Genomes.png 1,308 × 693; 120 KB
-
 Choosing reference genome.png 1,085 × 576; 120 KB
-
 Comare-genomes.png 1,123 × 219; 48 KB
-
Comp-Genomics Final Results.pdf ; 1.65 MB
-
Comp-Genomics Prelim Results.pdf ; 1.21 MB
-
 Comp phen.png 694 × 145; 8 KB
-
ComparativeGenomics Team2 HW.pdf ; 93 KB
-
-
-
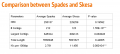 Comparison between Spades and Skesa.PNG 1,427 × 638; 40 KB
-
Compgenomics background.pdf ; 901 KB
-
 Correction.jpg 288 × 133; 13 KB
-
 De novo Assembly Using Skesa.PNG 1,521 × 787; 152 KB
-
 Debruijn simple.png 1,328 × 545; 133 KB
-
 DeepArg.png 1,455 × 742; 61 KB
-
 Denovopipeline.png 767 × 92; 8 KB
-
 Distribution of genome fraction coverage1.jpg 867 × 562; 24 KB
-
 Distribution of genome fraction coverage2.jpg 867 × 562; 29 KB
-
 Dongjo.jpg 527 × 527; 25 KB
-
 Door2.png 1,455 × 742; 56 KB
-
 Downloads Page.png 1,640 × 932; 487 KB
-
 Dtring.png 1,500 × 836; 202 KB
-
 EggNOG annotations.png 1,475 × 742; 55 KB
-
 Eggnog.png 520 × 1,219; 203 KB
-
 Eggnog pipeline.png 308 × 753; 83 KB
-
 Eunbi.jpg 216 × 247; 42 KB
-
 Evaluation assemblies.PNG 1,481 × 773; 174 KB
-
 Evaluation of distance between assemblies.PNG 1,481 × 773; 174 KB
-
 Evaluation of distance between samples1.png 1,381 × 301; 243 KB
-
 Evaluation of distance between samples2.PNG 771 × 160; 6 KB
-
 Evaluation of distance between samples2.png 771 × 160; 6 KB
-
 Evaluation of distance between samples3.png 325 × 325; 35 KB
-
 FINAL PIPELINE.jpg 752 × 563; 40 KB
-
 FINAL PIPELINE1.jpg 752 × 563; 40 KB
-
 Final-pipeline.png 887 × 459; 66 KB
-
 FinalGenePrediction.png 1,539 × 724; 127 KB
-
 FinalPipe GP1.png 1,240 × 600; 191 KB
-
Final Results.pdf ; 4.1 MB
-
Final Results (1).pdf ; 4.16 MB
-
Final Results Assembly.pdf ; 2.45 MB
-
 Final pipeline-functional-annotation.png 1,862 × 956; 258 KB
-
 Final pipeline.png 1,883 × 181; 128 KB
-
 Final pipelineGenePrediction1.png 1,198 × 546; 164 KB
-
 Fosfo res.png 329 × 245; 64 KB
-
 Frank Profile Picture.JPG 1,932 × 2,576; 1.03 MB
-
-
Functional Annotation Final Results.pdf ; 2.23 MB
-
Functional Annotation Presentation 1.pdf ; 1.45 MB
-
Functional Annotation Presentation 2.pdf ; 4.16 MB
-
Functional Annotation Presentation 3.pdf ; 4.57 MB
-
Functional Annotation Team2 Prelim .pdf ; 4.34 MB
-
Functional Annotation Team 2 PPT-1.pdf ; 2.42 MB
-
 Gbrandt.jpg 561 × 842; 130 KB
-
 Gbrandt smaller.jpg 281 × 422; 73 KB
-
 GeneMarkS hist.png 717 × 429; 7 KB
-
 GeneMark annotations.png 1,502 × 742; 53 KB
-
GenePredictionHW Team1.pdf ; 82 KB
-
-
GenePrediction Team2 HW.pdf ; 98 KB
-
Gene Prediction 1 HW.pdf ; 29 KB
-
 Genemark HMM.png 1,150 × 684; 106 KB
-
 General workflow.png 1,020 × 844; 218 KB
-
 Genevieve.JPG 2,244 × 3,366; 1.51 MB
-
GenomeAssembly Team1 Klebsiella.pdf ; 2.7 MB
-
-
-
Genome Res.-2008-Zerbino-821-9.pdf ; 588 KB
-
 Gkv1248fig1.jpg 799 × 2,204; 389 KB
-
 Global.png 765 × 101; 72 KB
-
 HMM.png 1,110 × 702; 422 KB
-
 Harshini.jpg 2,798 × 2,457; 1.13 MB
-
 Headshot.jpg 275 × 293; 101 KB
-
 Hetero.png 866 × 538; 11 KB
-
 Heteroresistant subpopulation.png 239 × 504; 185 KB
-
 Histogramofthelogtransformofthedistributionoftheclustersizes.png 1,362 × 739; 224 KB
-
 Hmm.png 750 × 600; 105 KB
-
 Home team1.PNG 1,197 × 930; 254 KB
-
 Homepage.png 1,678 × 924; 431 KB
-
 Homepage final.png 2,816 × 1,366; 280 KB
-
-
 Infernal reusults.png 970 × 528; 62 KB
-
 Intersecting LinePlot.png 1,000 × 598; 13 KB
-
Isolate-metadata.xlsx ; 19 KB
-
 Jane.jpg 146 × 185; 11 KB
-
 JianiPic.jpeg 588 × 772; 120 KB
-
 Junyu.jpeg 304 × 406; 58 KB
-
 KSNP1.png 986 × 235; 31 KB
-
 KSNP2.png 1,976 × 425; 184 KB
-
 KSNP3Tree.png 1,162 × 746; 61 KB
-
 KSNPresults.png 2,846 × 1,196; 512 KB
-
 Klebsiella.png 347 × 347; 344 KB
-
 Kunal.jpg 687 × 687; 139 KB
-
 L50.png 355 × 212; 32 KB
-
 LPS.png 560 × 489; 58 KB
-
 LPS2.png 612 × 489; 69 KB
-
 LPS3.png 343 × 321; 34 KB
-
 Laravel.png 560 × 210; 13 KB
-
Lecture1-Jordan-2018.pdf ; 121 KB
-
Lecture10-Espitia-2018.pdf ; 4.03 MB
-
Lecture10-Medina-2018.pdf ; 2.58 MB
-
Lecture12-Borodovsky-2018.pdf ; 4.84 MB
-
Lecture13-Marino-2018.pdf ; 5.29 MB
-
Lecture15-Chande-2018.pdf ; 3.25 MB
-
Lecture2-Chande-2018.pdf ; 625 KB
-
Lecture23-Chande-2018.pdf ; 588 KB
-
Lecture3-Chande-2018.pdf ; 634 KB
-
Lecture4-Jordan-2018.pdf ; 4.62 MB
-
Lecture5-Weiss-2018.pdf ; 20 MB
-
Lecture6-Jordan-2018.pdf ; 6.2 MB
-
Lecture7-Katz-2018.pdf ; 5.08 MB
-
 LipoP.png 1,486 × 742; 53 KB
-
 Lipoprotein.png 883 × 608; 50 KB
-
 Local.png 717 × 95; 56 KB
-
 MBorodovsky.jpg 146 × 200; 30 KB
-
 Manhattan plot.png 1,622 × 919; 496 KB
-
 Manhattanp.png 1,029 × 650; 282 KB
-
 Mash Distance of Assemblies.PNG 1,537 × 817; 102 KB
-
 Mash distances.png 791 × 529; 122 KB
-
 Mash distances cluster.png 671 × 535; 108 KB
-
 Merge-union.png 702 × 574; 76 KB
-
 Metadata.png 546 × 305; 27 KB
-
 Mhseabolt.jpg 1,140 × 1,236; 566 KB
-
 Michael-Ng-head-shot.jpeg 445 × 517; 46 KB
-
 Mlst table.png 1,070 × 422; 47 KB
-
 Mohit.jpg 436 × 455; 57 KB
-
 MultiQC.png 1,428 × 606; 148 KB
-
 Multialign.png 1,770 × 796; 231 KB
-
 N50.png 378 × 131; 20 KB
-
 NA font.png 866 × 538; 12 KB
-
 New workflow.png 1,384 × 574; 106 KB
-
 Nirav.jpg 276 × 368; 11 KB
-
 Nucleotide clustering.png 423 × 286; 29 KB
-
 Operons.png 498 × 277; 45 KB
-
 Overall stats.PNG 379 × 501; 15 KB
-
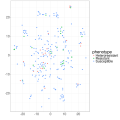
 PCA phenotype.png 3,000 × 3,000; 149 KB
-
 PCA species.png 3,000 × 3,000; 205 KB
-
 Parisa.png 180 × 260; 98 KB
-
 Phaster.png 2,228 × 1,364; 226 KB
-
 Phobius.png 1,494 × 742; 54 KB
-
 Photo-Weiss.png 151 × 150; 73 KB
-
 Piggy.png 866 × 538; 7 KB
-
 Piggy1.png 866 × 538; 11 KB
-
 Piggy2.png 866 × 538; 5 KB
-
 Piggy figure.png 1,397 × 520; 173 KB
-
 Piggyfinal2.png 866 × 538; 6 KB
-
 Pip.png 1,384 × 574; 106 KB
-
 Pipeline.png 2,175 × 1,146; 454 KB
-
 Pipeline2.png 940 × 479; 25 KB
-
 Pipline.png 1,520 × 1,240; 29 KB
-
 Pooja.jpg 448 × 322; 37 KB
-
 Prach.jpg 423 × 625; 137 KB
-
PredictiveWebserverPrelim.pdf ; 1.19 MB
-
Preliminary Results Presentation.pdf ; 2.42 MB
-
 Prodigal.jpg 1,200 × 799; 55 KB
-
 Prodigal annotations.png 1,492 × 742; 57 KB
-
 Prodigal hist.png 717 × 429; 6 KB
-
 Prodigal results.png 1,108 × 690; 96 KB
-
 ProfJordanPic.jpg 500 × 500; 86 KB
-
 Pyani.png 683 × 197; 8 KB
-
 Pyani team1.PNG 1,249 × 739; 60 KB
-
 Pyani updated.png 887 × 189; 18 KB
-
 QiZhangPic.jpg 2,806 × 2,423; 157 KB
-
 QinweiZ profile.jpeg 1,064 × 1,417; 280 KB
-
 QinyuYue.jpg 1,101 × 1,101; 296 KB
-
 Qiuyi profile.jpg 1,229 × 1,080; 227 KB
-
 Quality of assemblies.PNG 1,325 × 833; 127 KB
-
 Quast.png 1,075 × 695; 92 KB
-
 Quast comparison of de novo and reference assemblies.jpg 3,072 × 781; 153 KB
-
 Quast comparison of de novo and reference assemblies1.png 1,594 × 885; 118 KB
-
 Quast comparison of de novo and reference assemblies2.png 1,598 × 885; 491 KB
-
 Quast sspace.png 2,167 × 1,218; 102 KB
-
 Quast table.png 711 × 667; 174 KB
-
 Quast table sspace.png 1,555 × 1,170; 183 KB
-
 RGI.png 654 × 630; 144 KB
-
 RJ BW.JPG 474 × 429; 120 KB
-
 RJ portrait.JPG 200 × 276; 48 KB
-
 RNAmmer results.png 1,026 × 626; 66 KB
-
 Ragy5.jpg 3,641 × 3,322; 5.54 MB
-
 Ref assembly.png 841 × 388; 73 KB
-
 Relative percentages.png 1,865 × 938; 487 KB
-
 Resistant font.png 866 × 538; 12 KB
-
 Rgi.png 1,268 × 746; 106 KB
-
 Rjplace.jpg 517 × 438; 103 KB
-
 SPAdes N50.PNG 1,268 × 681; 71 KB
-
 SPAdes dendrogram.png 1,074 × 195; 145 KB
-
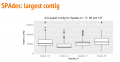 SPAdes largest contig.PNG 1,275 × 661; 78 KB
-
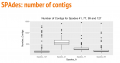 SPAdes number of contigs.PNG 1,258 × 663; 83 KB
-
 Samples tsne phenotype.png 3,000 × 3,000; 210 KB
-
 SarthakSharma.jpeg 925 × 935; 74 KB
-
 Sathomas.jpeg 767 × 802; 30 KB
-
 SaurabhGulati.jpg 533 × 558; 54 KB
-
 Scaffolding Using SSPACE.PNG 1,513 × 711; 157 KB
-
 Scafolding.png 767 × 390; 169 KB
-
-
 Screen Shot 2018-03-05 at 11.33.37 AM.png 897 × 501; 71 KB
-
 Screen Shot 2018-04-09 at 10.28.43 PM.png 1,968 × 1,202; 282 KB
-
 Screenshot (100).png 1,191 × 1,218; 87 KB


.png)